Apple iPhone Market Share: 2007 to 2023

Published Date: August 21, 2023
A repository of quarterly data for Apple iPhone market. This data is based on iPhone shipments by quarter that can help you understand the market scenario and Apple’s performance in the quarter.
Apple iPhone Shipments: Annual
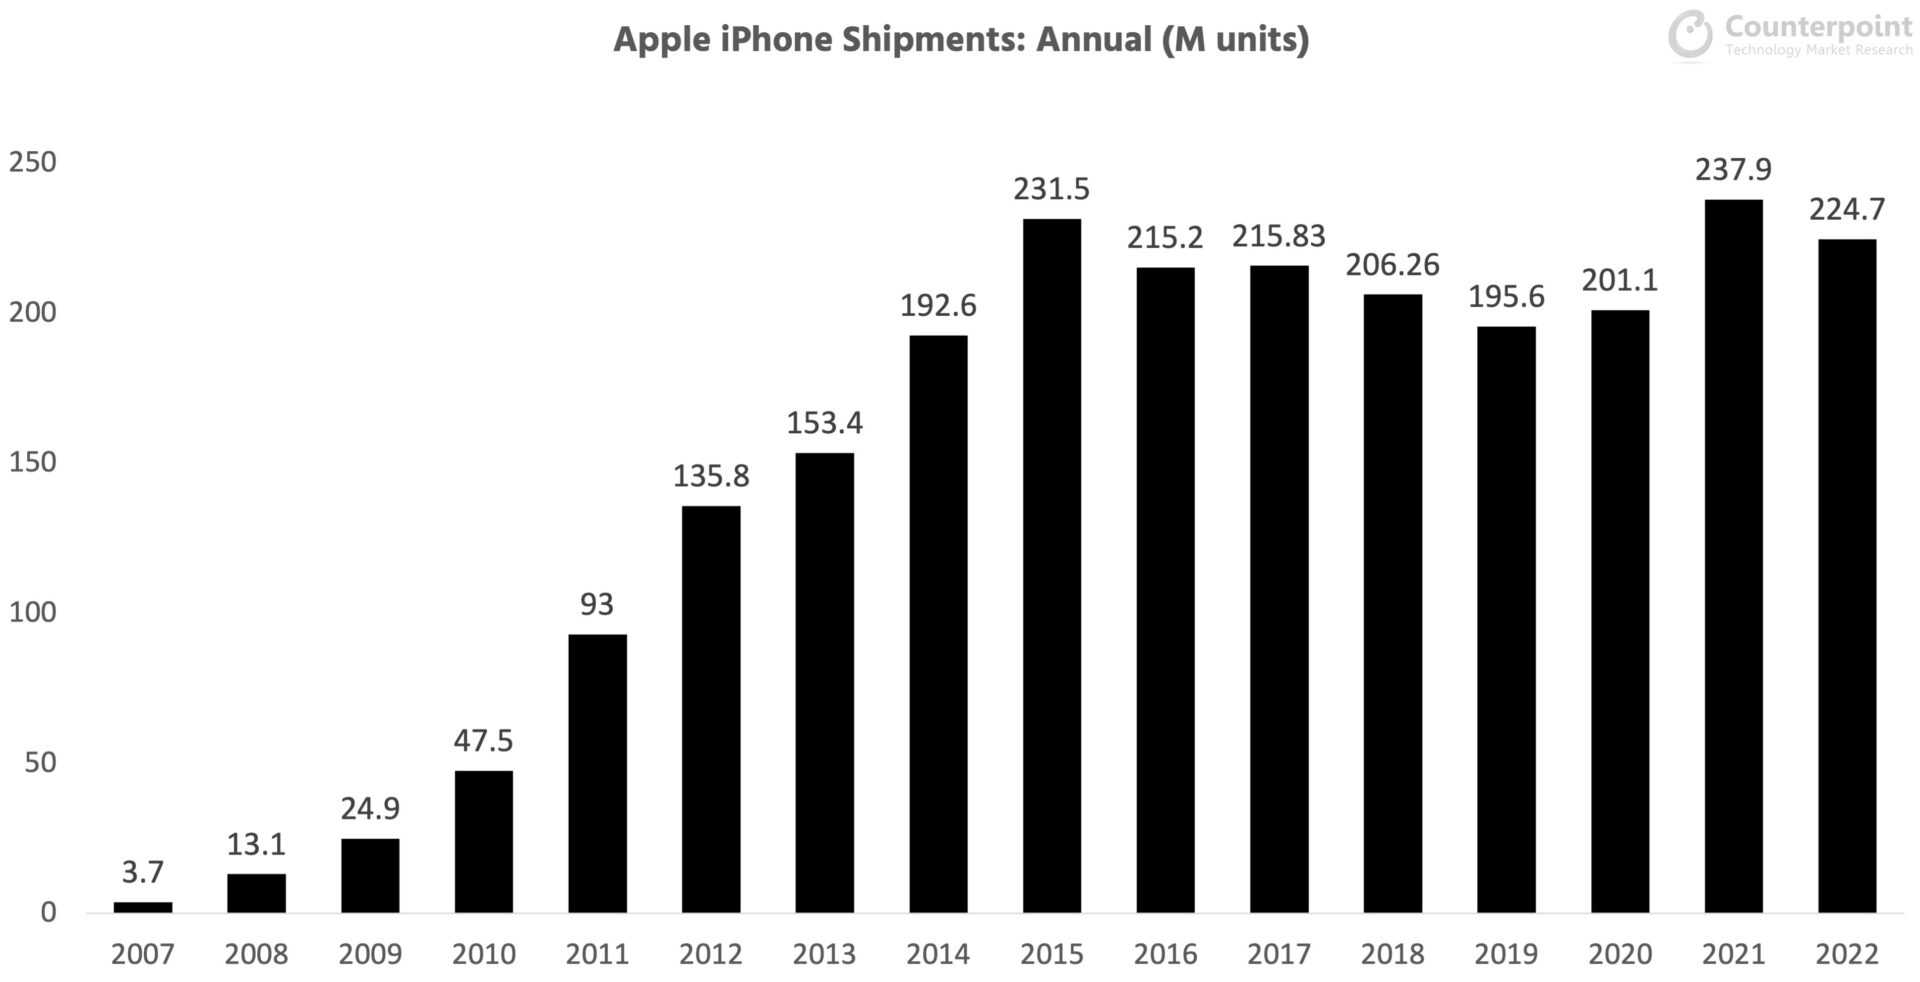
| Apple iPhone shipments (M units) | ||||||||||||||||
| Year | 2007 | 2008 | 2009 | 2010 | 2011 | 2012 | 2013 | 2014 | 2015 | 2016 | 2017 | 2018 | 2019 | 2020 | 2021 | 2022 |
| Shipments | 3.7 | 13.1 | 24.9 | 47.5 | 93 | 135.8 | 153.4 | 192.6 | 231.5 | 215.2 | 215.83 | 206.26 | 195.6 | 201.1 | 237.9 | 224.7 |
Apple iPhone Market Share: Annual
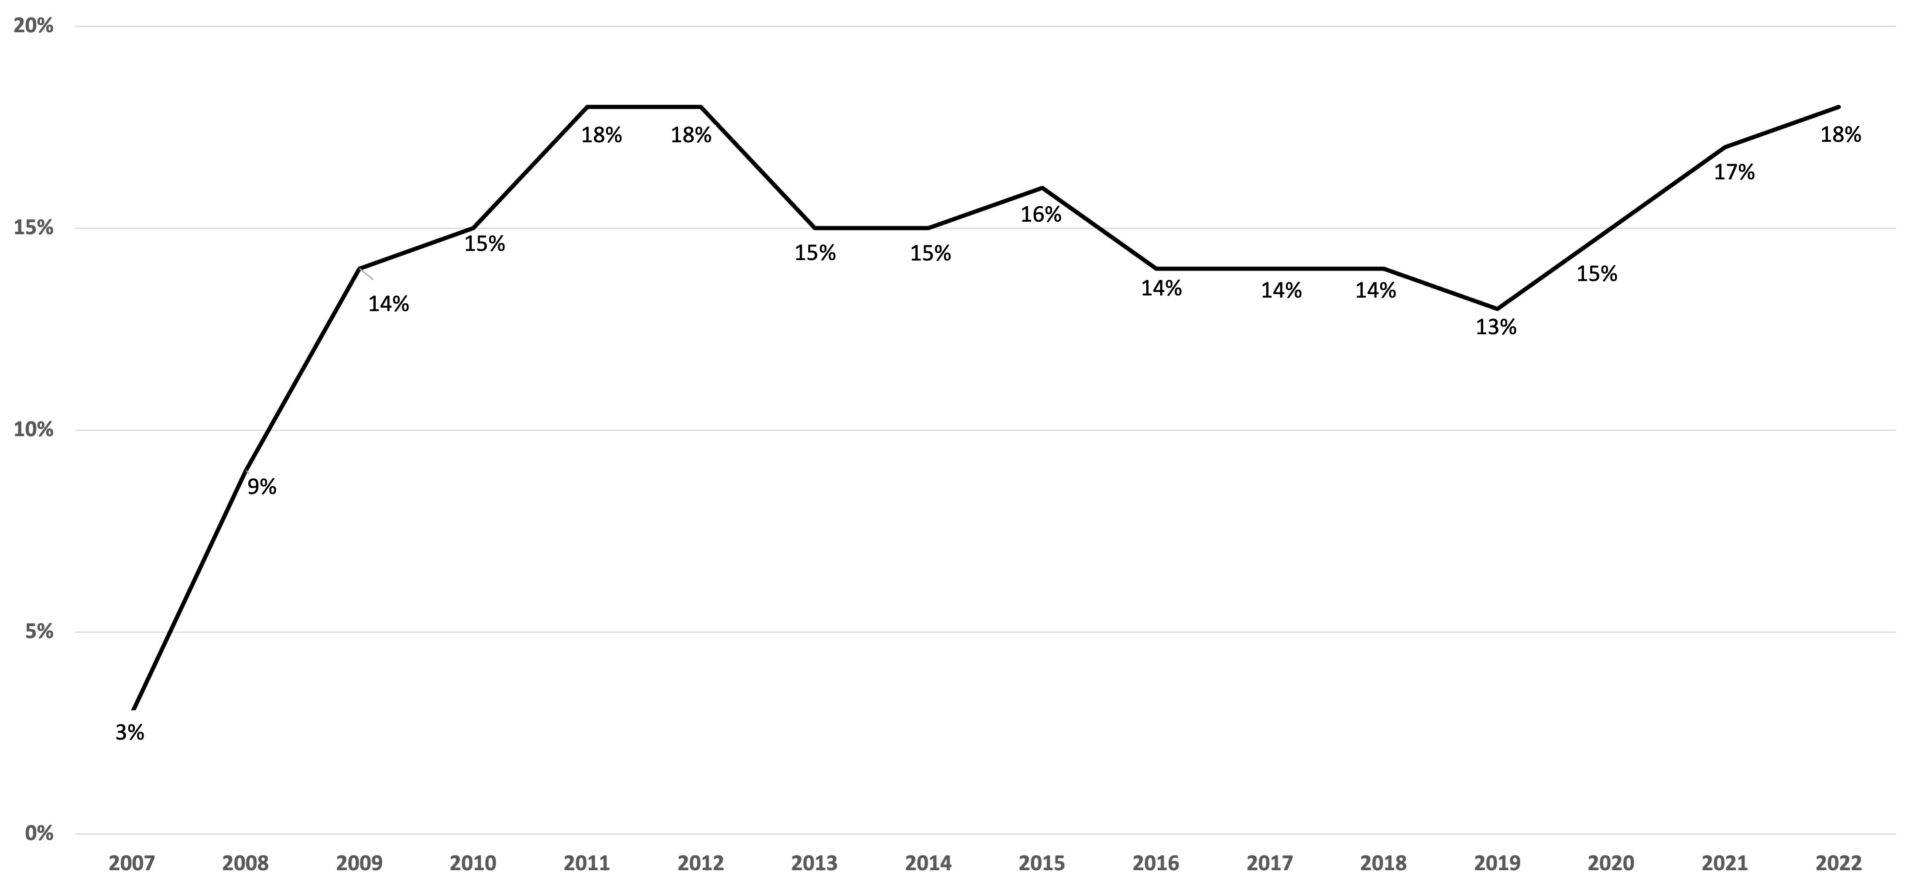
| Apple iPhone market share | ||||||||||||||||
| Year | 2007 | 2008 | 2009 | 2010 | 2011 | 2012 | 2013 | 2014 | 2015 | 2016 | 2017 | 2018 | 2019 | 2020 | 2021 | 2022 |
| Market Share | 3% | 9% | 14% | 15% | 18% | 18% | 15% | 15% | 16% | 14% | 14% | 14% | 13% | 15% | 17% | 18% |
Apple iPhone Shipments: By Quarter
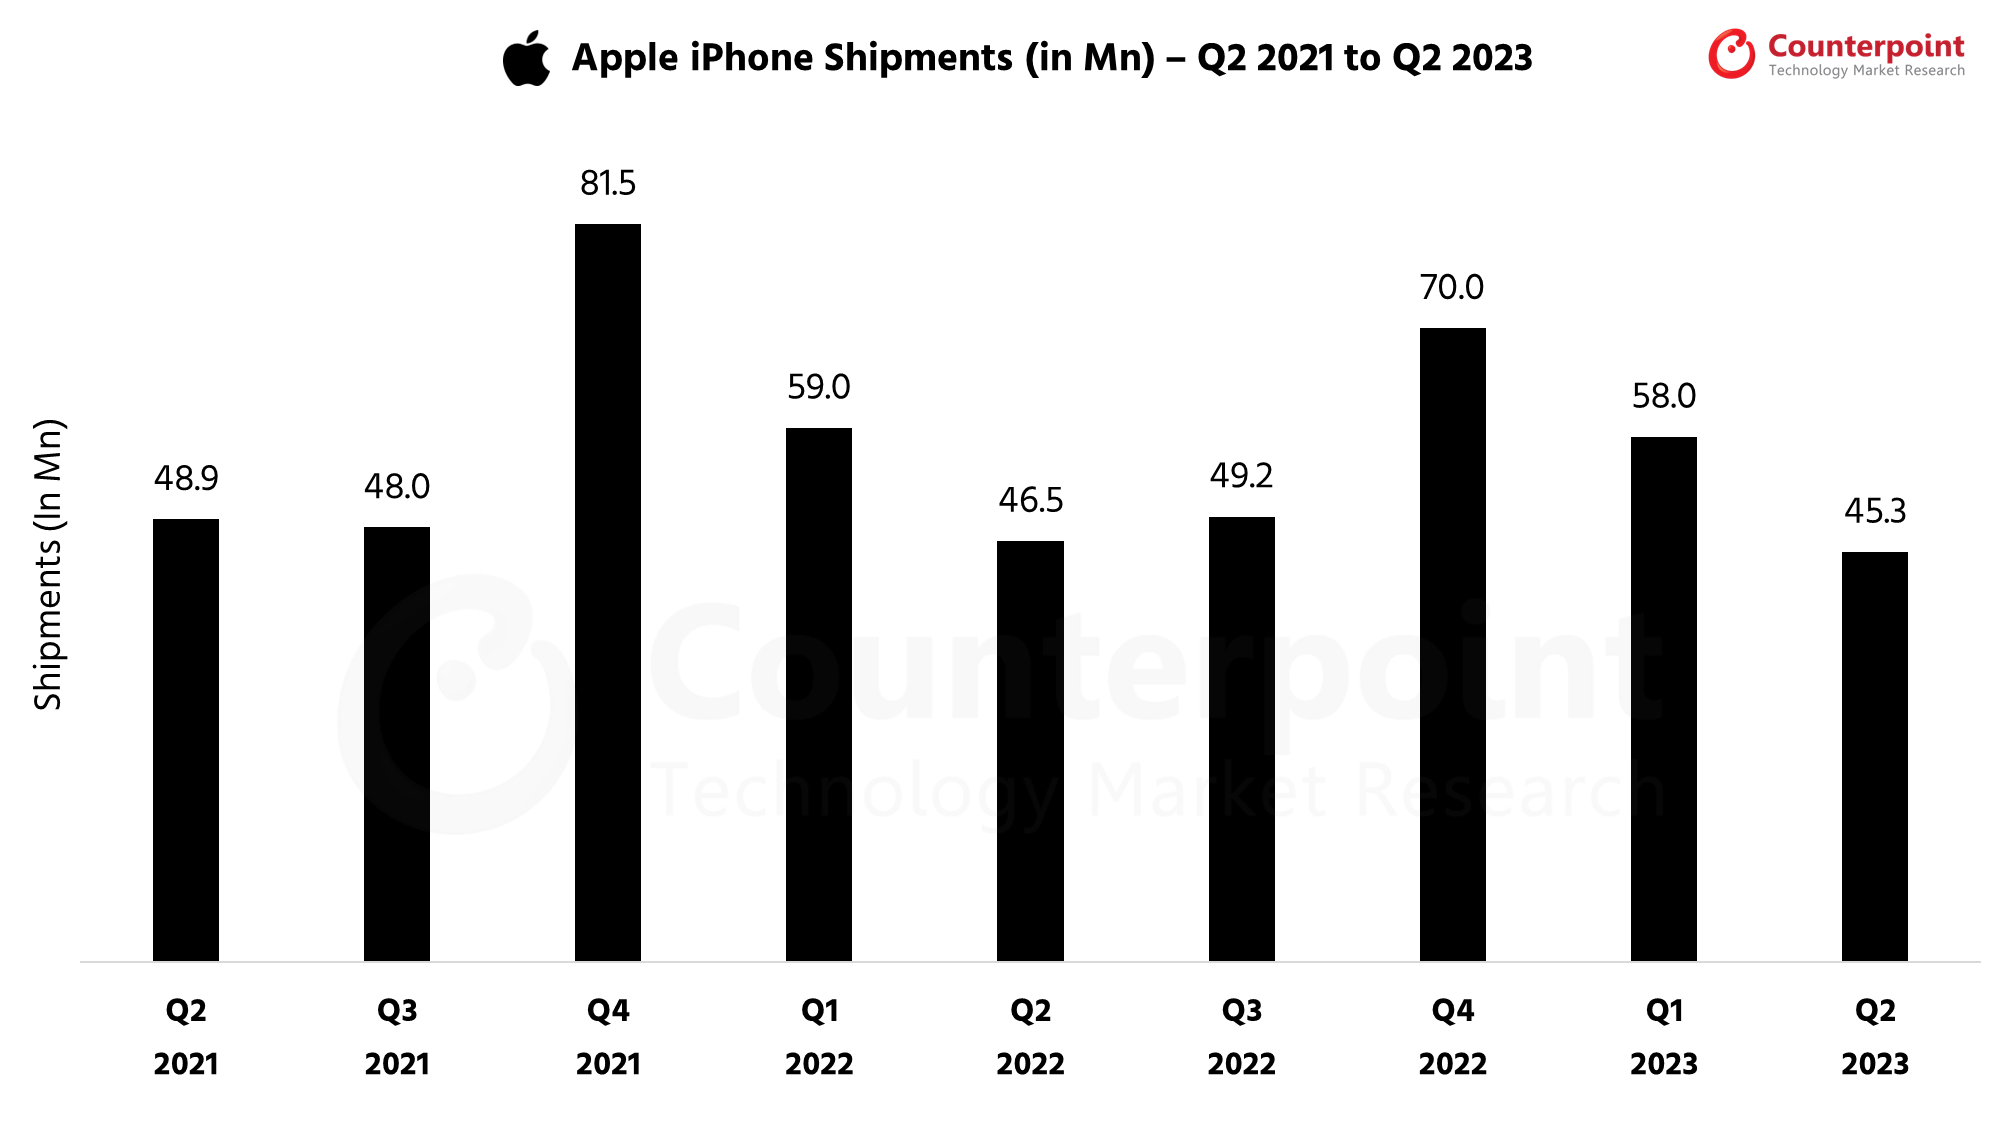
| Apple iPhone Shipments (in Millions) | |||||||||
| Quarter | Q2 2021 | Q3 2021 | Q4 2021 | Q1 2022 | Q2 2022 | Q3 2022 | Q4 2022 | Q1 2023 | Q2 2023 |
| Shipments (in Mn) | 48.9 | 48 | 81.5 | 59 | 46.5 | 49.2 | 70 | 58 | 45.3 |
DOWNLOAD:
(Use the buttons below to download the complete chart)


Apple iPhone Market Share: By Quarter
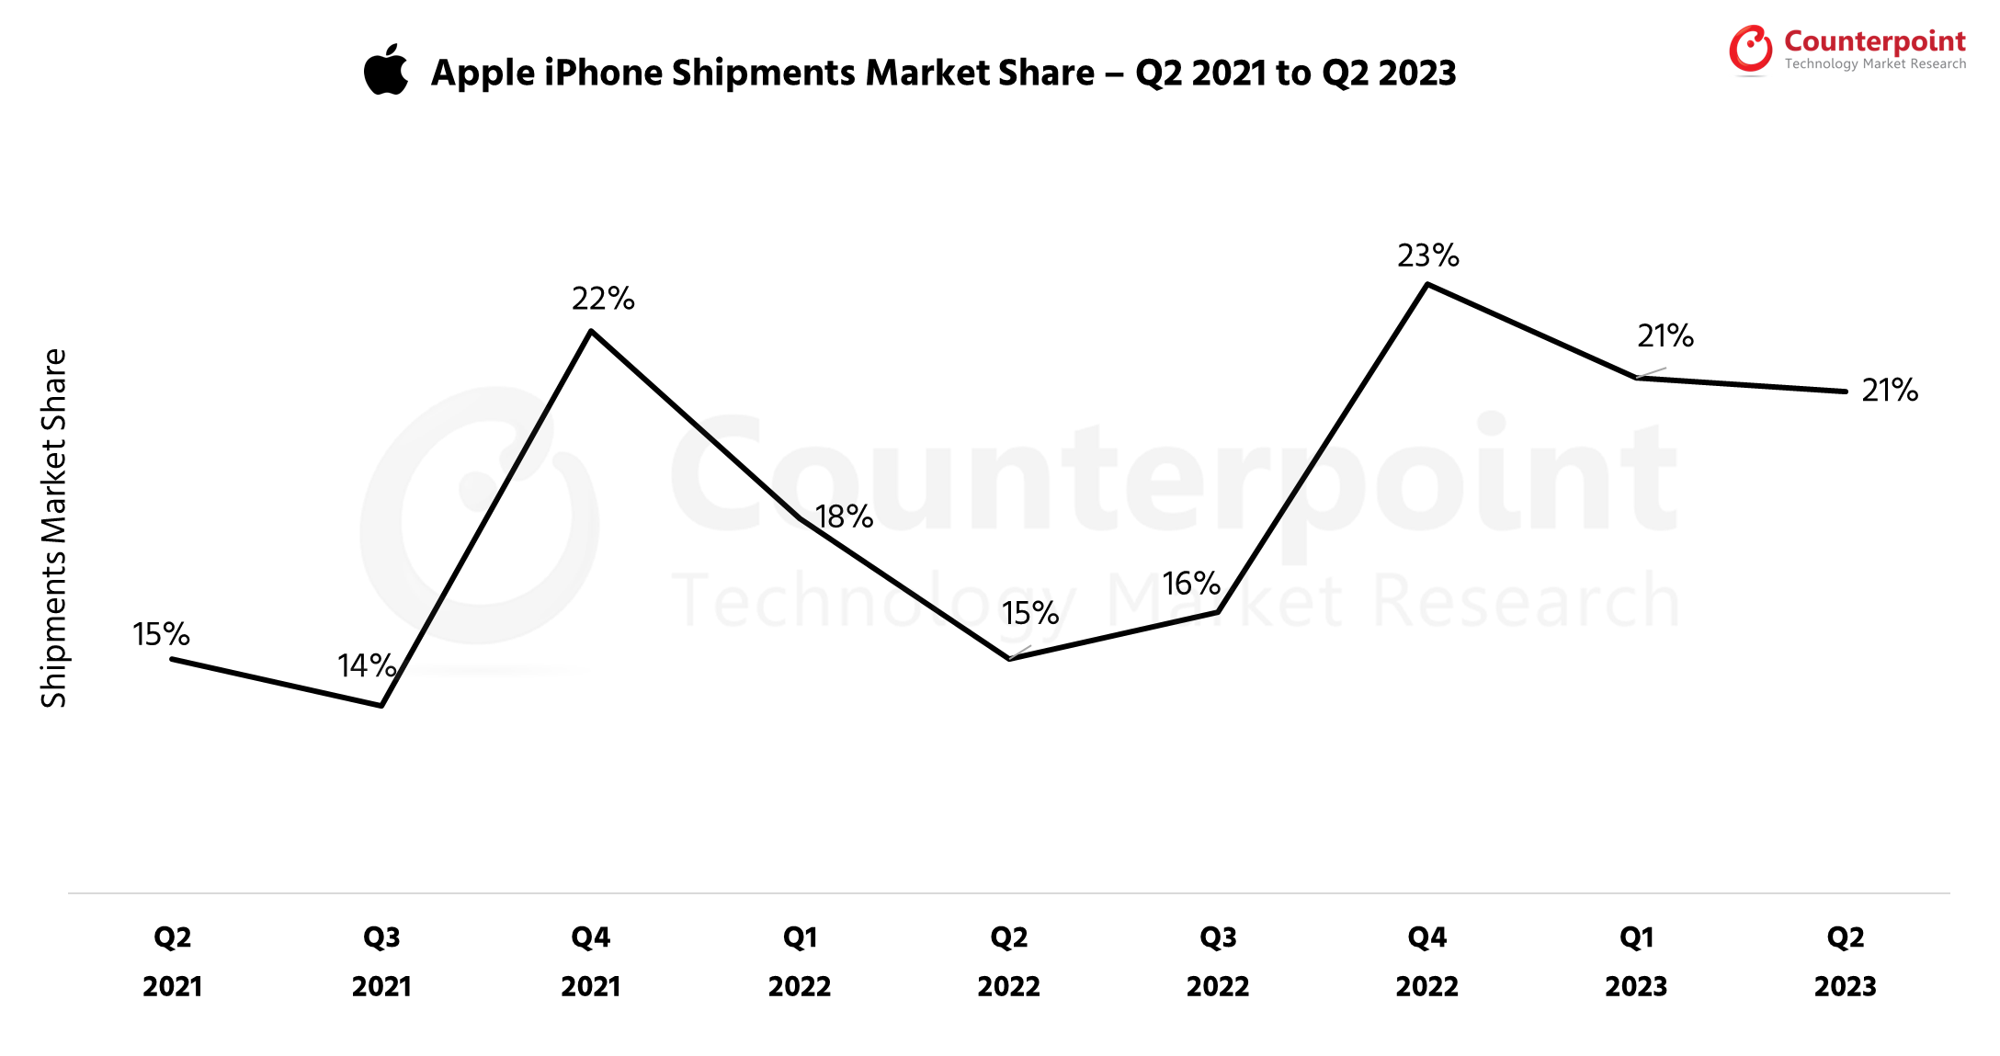
| Apple iPhone Shipments Market Share (%) | |||||||||
| Quarter | Q2 2021 | Q3 2021 | Q4 2021 | Q1 2022 | Q2 2022 | Q3 2022 | Q4 2022 | Q1 2023 | Q2 2023 |
| Shipments Market Share (in %) | 15% | 14% | 22% | 18% | 16% | 16% | 23% | 21% | 21% |


